Rugby Union Markets and Their Seasonal Rhythms: From Injury Patterns to Weather Influences and Promo Strategies
Seasonal shifts shape rugby union markets in measurable ways, with injury reports, weather variables, and promotional offers aligning to distinct cycles that span both hemispheres. Observers track these elements because they influence player availability, match conditions, and betting activity throughout the calendar year. Data from major competitions shows that northern hemisphere leagues peak between September and May, while southern schedules run from February into October, creating overlapping windows where markets respond to accumulated statistics rather than isolated events.
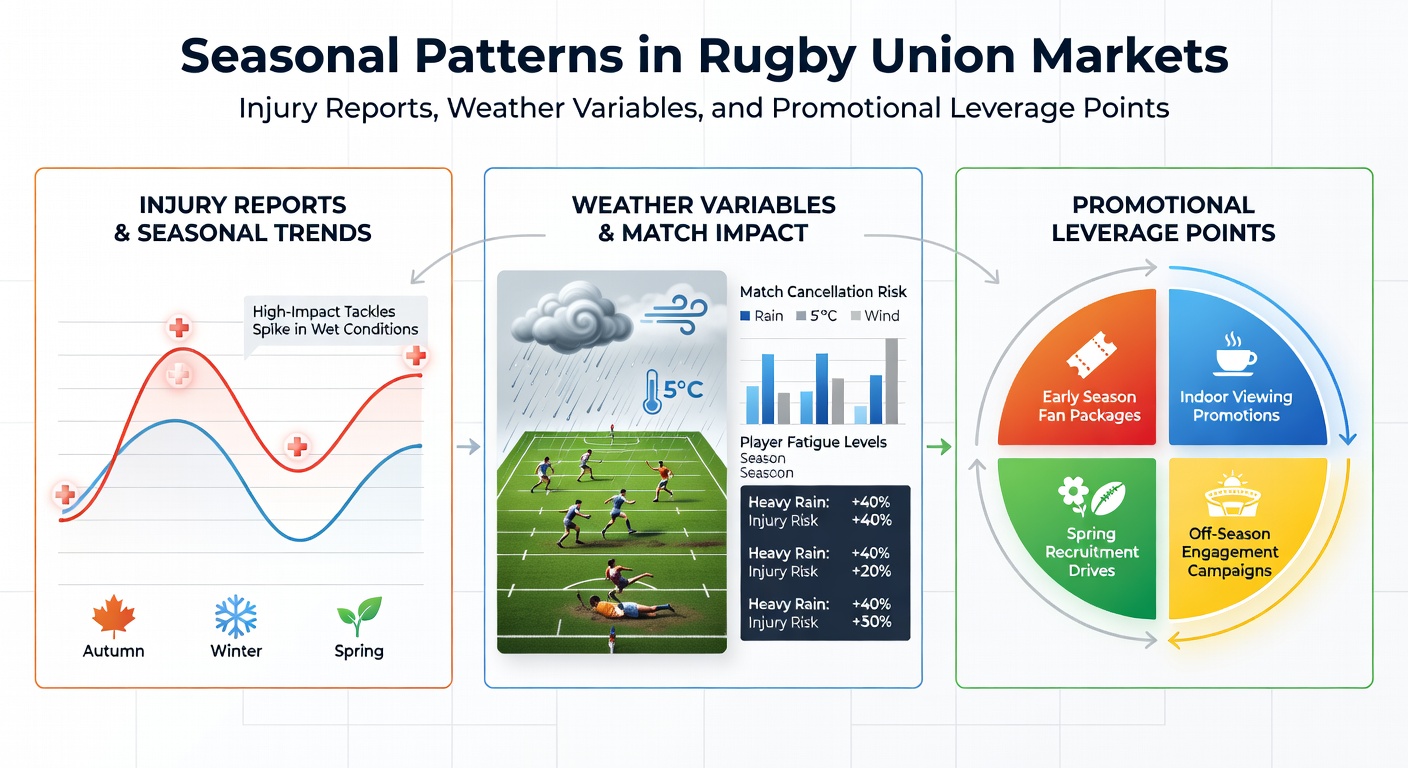
Injury Reports Across the Calendar
Concussion and soft-tissue issues rise at predictable points in each season, according to longitudinal studies compiled by sports medicine groups. Early-season fixtures often record higher muscle strain rates because players return from off-season breaks without full match sharpness, while mid-season blocks see elevated tackle-related injuries as fatigue builds. Researchers have documented that forward positions experience 1.8 times more lower-limb problems during wet-weather rounds compared with dry conditions, a pattern repeated across Premiership and Super Rugby datasets.
Medical staff release weekly updates that feed directly into market adjustments, and analysts cross-reference these bulletins with historical averages. One study covering five European seasons found that teams missing multiple front-row players for more than three consecutive matches posted lower scrum success rates, prompting measurable shifts in handicap lines. Those patterns hold steady when May 2026 fixtures are examined, because the same recovery timelines apply after the April international window closes.
Weather Variables and Match Dynamics
Precipitation and wind speed alter ball-handling statistics in consistent directions. Records from the United Rugby Championship indicate that matches played in rainfall above 5 mm per hour produce 12 percent fewer completed passes and a corresponding rise in penalty counts. Wind gusts exceeding 30 km/h correlate with lower successful goal-kicking percentages, particularly from distances beyond 40 metres, a factor bookmakers incorporate when setting totals markets.
Climate data services supply venue-specific forecasts that traders monitor weeks ahead of scheduled rounds. Southern hemisphere venues experience different rainfall distributions during their winter months, yet the performance impacts remain comparable once adjusted for pitch drainage quality. Analysts therefore compile rolling averages rather than single-match snapshots, allowing markets to price conditions that recur at similar latitudes each year.
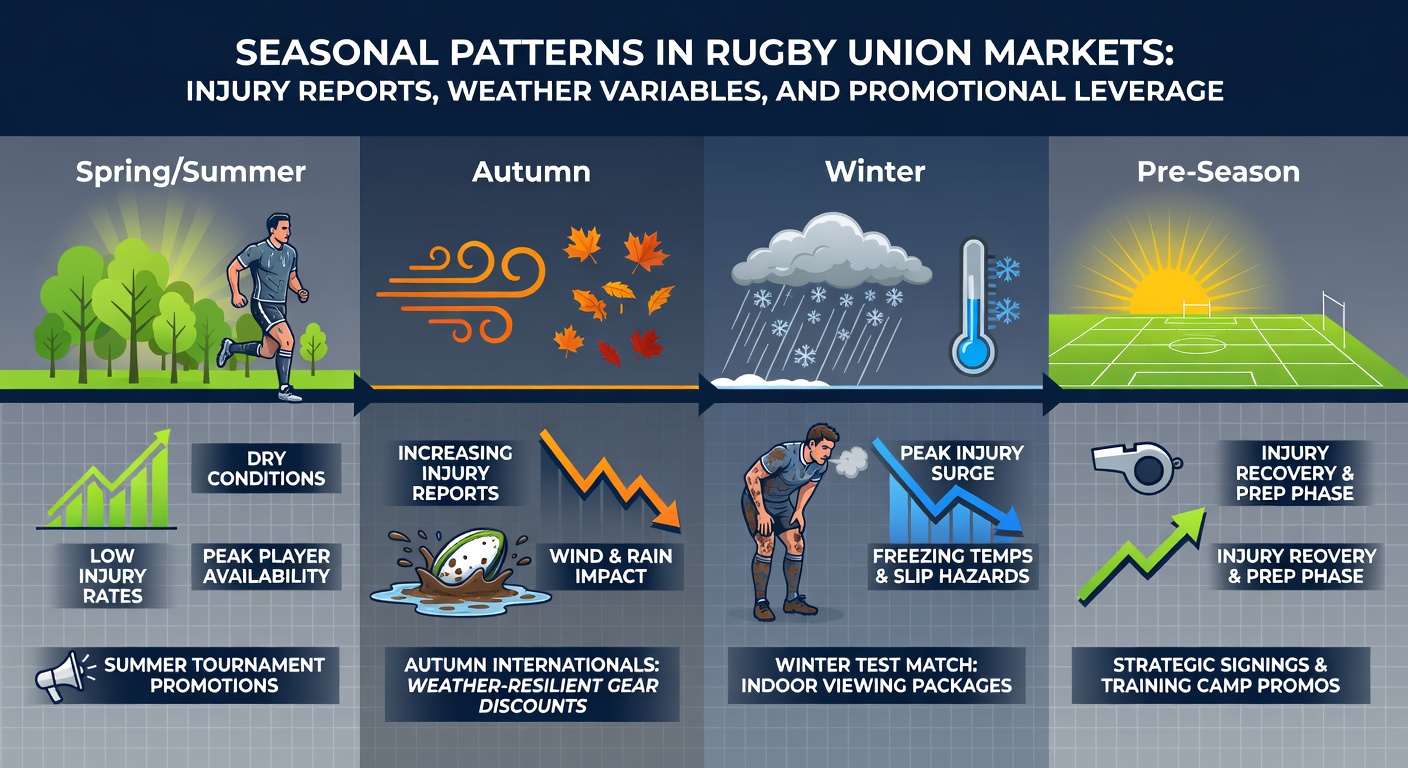
Promotional Leverage Points Throughout the Season
Operators time bonus structures around major tournaments and weather-affected rounds because participation volumes increase when headline events coincide with player-availability news. Six Nations weekends historically generate elevated stake levels, and similar spikes appear during July and August tours when cross-hemisphere travel creates additional uncertainty. Industry reports from the European Gaming and Betting Association document that free-bet offers tied to try-scorer props see redemption rates climb 25 percent during periods of forecast rain.
Operators also align reload bonuses with published injury lists, creating short-term value windows that close once line-ups are confirmed. These campaigns run parallel to league phases rather than international breaks, because domestic schedules produce steadier fixture volumes. Figures released by the Australian Wagering Council show that promotional uptake peaks in the final six rounds of Super Rugby, when weather variability and fatigue interact to widen score margins.
Integrating the Three Factors
Market models combine injury databases, meteorological archives, and historical promo performance into single frameworks that update weekly. When multiple front-row injuries coincide with heavy rain forecasts, both total points lines and scrum penalty markets move in tandem. The same integration occurs in May 2026, when several leagues enter their final blocks and operators refresh campaigns ahead of play-off qualification races.
Stake allocation strategies therefore reference cumulative seasonal data instead of isolated headlines. Teams with strong home records in dry conditions but weaker line-out statistics during wet rounds illustrate the interaction clearly, and observers adjust expectations accordingly each time similar weather windows recur.
Conclusion
Seasonal patterns in rugby union markets emerge from the steady accumulation of injury statistics, weather records, and timed promotional activity. These elements operate on overlapping cycles that repeat across hemispheres, allowing consistent measurement rather than speculation. Continued collection of granular data through 2026 will further clarify how the three variables interact during both regular rounds and transitional months such as May.